Monday, July 6, 2009

Forex Market Hours: Can You Trade Currency 24/7?


The forex market hours stretch from Monday morning in Sydney, Australia to Friday afternoon in New York. During that time the market is open somewhere around the globe at all hours of the day or night.

However it is not a 24/7 market because it does shut down on weekends. 24/5 would be more accurate.

If you need to know the exact times that the markets open and close, you have to take time zones into consideration. It is very simple when expressed in UTC. This is Universal Coordinated Time, formerly known as Greenwich Mean Time. This is the standard (winter) time in Greenwich, London which is the point of zero longitude on the globe.

So, the normal forex market hours are 22.00 Sunday UTC to 22.00 Friday UTC. This is 10 pm in the UK in winter time.

New York is 5 hours behind the UK so the global forex market opens and closes at 5 pm Sunday/Friday in New York, 2 pm on the US west coast, 11 pm in Germany, 8 am Monday/Saturday in Sydney.

Things get a little complicated when you start to try to take summer time daylight saving into account. This makes one hour difference in countries that observe it. But daylight saving operates in a different way in the southern hemisphere countries such as Australia which have summer time from September to March instead of March to September.

The hours of the different major national markets are as follows:

Sydney: 10 pm to 7 am UTC
Tokyo: 12 midnight to 9 am UTC
London: 8 am to 5 pm UTC
New York: 1 pm to 10 pm UTC

Or we can express that in EST (Eastern US time):

Sydney: 5 pm to 2 am EST
Tokyo: 7 pm to 4 am EST
London: 3 am to 12 noon EST
New York: 8 am to 5 pm EST

You can see that these correspond to 24 hour cover.

However, this does not necessarily mean that trading will be good at all of these times. Just after a major market opens, the prices can be very volatile and unpredictable. Many traders will stay out of the forex market for up to an hour four times a day when the financial markets are waking up in these major cities.

The US dollar is the most traded currency by a long way, involved in 2.5 times as many trades as its nearest rival the euro. This means that events in the USA have a greater impact on the financial markets than events in other countries. The New York market tends to slow down around 3 pm local time (8 pm UTC) and if you are involved in a US dollar pair, this can be a good time to stop trading for the day.

So theoretically you can trade 24 hours a day from Sunday night to Friday night. Automated software in the form of a forex robot can even make this physically possible. However, a cautious trader will choose his times and will not be active during all of the forex market hours.
Read rest of entry

Beginner Forex Currency Trading: What Is It All About?


For a beginner forex currency trading may seem to be a whole new world but in fact the basics are quite easy to learn. You just need to understand the buzz words and trading terms and grasp a basic understanding of how the markets work.

Making big money in a short time is what forex currency trading is all about! It is possible for investors to make a lot of money very fast because the rates of exchange on the foreign market can rise and fall quickly. This means of course that it is risky and there is also a chance of losing a lot, just like most things in life that have the potential of big returns.

As you will know if you have ever exchanged currency for a vacation, the rates are constantly changing. For example you may change $100 into another currency planning to travel, and then find that you do not need it and change it back. The rate will probably have changed in the meantime and you may even have made a profit.

Forex traders deal in currencies hoping to make a profit all of the time, but instead of changing money at the bank they use a broker. Most transactions these days are handled online. In many ways it is not so different from stock trading. There is the same potential to trade in margins where a small balance held by your broker can control much larger deals.

One difference from stock exchange trading is that forex traders are not limited to dealing in their own country. You can trade any two currencies regardless of where you live. This also means that the market is international. Because of time zone differences, it is open 24 hours a day from Monday morning in Australia to Friday afternoon in New York.

Each currency is represented by 3 letters: USD for the US dollar, GBP for the British pound, EUR for the Euro, JPY for the Japanese Yen, CHF for the Swiss franc, CAD for the Canadian dollar, AUD for the Australian dollar etc. The exchange rate between two currencies may be expressed like this: USD/CHF 1.14. This means that to buy one US dollar you will need 1.14 Swiss francs.

If you want to start out in forex trading you will need to look for a broker or investment management company that you trust. It is worth shopping around and checking online forums for recommendations. Check out how long the company has been in business and what your rights and liabilities will be. Read all of the fine print.

You will probably also want to use a bot to do your trading for you. This is automated forex trading software that can trade 24 hours a day according to rules that you set for it. There is usually a demo option so that you can test out the whole system for a while before you let it trade with real money. There are many forex robots on the market and most of them come with full instructions for beginner forex currency trading.
Read rest of entry

Tuesday, June 23, 2009

Forex Trading: The Most Common Flaws


Flaws due to multi indicators and due to the principle of confluence:

Many traders are very much attracted to the sophistication offered by the multi indicators and use them in their forex trading systems. Many of the confluence system indicators show the price movement and in no way adds any value to the trade. Due to this, the traders either end up over bought or over sold technical indicators like the stochastic, momentum indicators, candle stick chart pattern recognition, Bollinger band breaks out even neural networks which are supposed to be artificial intelligent systems. The technical indicators just show signals which are similar to buy or sell or hold, making the signal generated to be correct. Theoretically it sounds good but in reality to arrive at a conclusion might be difficult. As a result the traders are confused in making a right decision. They either enter too late or too early or remain still without being able to make a decision to enter the market. The major flaw is due to the use of useless trading system which does not serve the purpose to make profits, but confuses the traders and complicates the forex trading until the trader loses.

Another dangerous flaw found in forex trading is of an emotional nature interwoven into the process. It is fear and greed of the trader. A profitable forex trade can lead to exuberance and over joy, but this is the time when greed comes in and crosses the aspects of risk management. When a trader is hooked to winning, out of greed he over-rides all aspects to see more and more profits, only to see them crash to earth. They wait for the prices to regain, but in dismay may some time and with worst possible losses. This is the time when fear crops up and paralyses the trader not making him to open up any position. Hence while trading, the trader should not override the emotional side of trading, stick to discipline of the trade which can prevent them from committing the flaw of forex trading.

Another kind of flaw can happen when the trader is an unconcerned person or the one who is lazy, or with no drive to gain profits or feels the need to be profitable. These people would have entered into forex trading due to hearing it as an easy game. For them it is not a trade which involves skill, trade management, preparation and re-investment. It is a fun game for them, where loses do not make any difference to them. Such persons make a wrong footing, with a wrong objective.

Flaws in forex trading due to the inadequate knowledge of the trader:

Some of the losers start with good purpose in the trade. Even though they had gained some knowledge from here and there they might find it difficult to apply them practically in the trade. Inadequate knowledge might be the major flaw which stops them from achieving success.
Read rest of entry

Forex Profits by buying and selling at the same time?


This article is one of a series which looks at the advantages and weaknesses of trading using the hedged, grid trading system to trade volatile markets.

We will look at how money can be made by breaking a number of trading truths or principles; * cut your losses and let your profit run and * there is nothing to gained by entering into buy and sell deals at the same time.

The hedged grid trading system uses the principle that one should be able to cash in at a gain no matter which way the market moves. No stops are therefore required at all. The only way this is logically possible is that one would have a buy and sell active at the same time. Most traders will say that that is trading suicide but let’s take some to look at this more closely.

Let’s say that a trader enters the market with a buy and sell active when a currency is at a level of say 100. The price then moves to 200. The buy will then be positive by 100 and the sell will be negative by 100. At this point we start breaking trading rules. We cash in our positive buy and the gain of 100 goes to our account. The sell is now carrying a loss of -100.

The grid system requires one to make sure that cash in on any movement in the market. To do this one would again enter into a buy and a sell transaction. Now, for convenience, let’s assume that the price moves back to level 100.

The second sell has now gone positive by 100 and the second buy is carrying a loss of -100. According to the rules one would cash the sell in and another 100 will be added to your account. That brings the total cashed in at this point to 200.

Now the first sell that remained active has moved from level 200 where it was -100 to level 100 where it is now breaking even.

The 4 transactions added together now magically show a gain:- 1st buy cashed in +100, 2nd sell cashed in +100, 1st sell now breaking even and the 2nd buy is -100. This gives an overall a gain of 100 in total. We can liquidate all the transactions and have some champagne.

There are many, many other market movements that turn this strange “buy and sell at the same time” activity into gains. These will be covered in future articles and are covered in a free grid trading course which is available at the expert-4x.com website for those traders whose curiosity has been aroused.

There will be more on the hedged grid trading articles to be issued regularly. Please watch this site.
Read rest of entry

How to choose smart Stop Loss in Forex Trading


Here is step by step guide:

1. If price is close to recent high or low then place SL 5-10 pips above or below that point. This is very important. Prices do go back to test recent highs and lows and we need to set SL as per the recent price action. Trading on daily chart is bit tricky where such SL can be even 30-40 pips more on top of your static 100 pip SL.

2. Another point to take care is that don’t place SL on important boundary numbers such as 00 or 50 mark. These points are tested often and you can easily be stopped out.

3. Place your stop loss on odd numbers excluding 1 and 9. Never place SL on even numbers.


Believe It or Not!!!

Let me surprise some of you by saying that Brokers HUNT for your SL. That’s true. Forex is unlike Dow where everything is run by one organization and prices don’t vary from broker to broker (those broker makes money by giving you a worse fill than you would expect + commissions). Brokers in Forex can manipulate prices as they like and hence they go after your SL.

Now why brokers will want to you to loose?? Well every time you open a position, a broker opens an opposite position. So when you loose they win. They also want you trade more often, since they make money either in commission or spreads (or both). The only way they can force you to trade again is to stop you out.

Why you think brokers give out free market research and trading ideas?? If all of their traders are trading the same way then it is easier for them to take them out.

I am sure that some people would disagree (the ones working for broker J ) but it is something to think about.

So How To Beat The Brokers:

Simple, don’t place any Stop Loss. That’s right. It is not a typo. What you need is a Mental SL. You should know at price you will take your losses and set up alarms on your trading station when the price reach close to the mental SL you had in place. This can be challenging for some people but if you are lucky enough to get this working then there is nothing like it.

Hope this helps you in placing better SL from now on.
Read rest of entry

Learning the Ropes of Forex trading and Getting Ahead of the Game Early On


In the world of cut-throat business, it pays to know your way around. And in the world of forex trading it pays to know the market, the players and the stakes. In forex trading, you need to know what you’re looking at – the value of the currency you’re trading, the factors that affect the value of your currency, the trading strategies and the market trends.

Fundamental to forex trading is research. But as we are talking about big bucks here, a good forex trading course would be helpful.

Why Go for a Trading Course

A Forex trading course teaches you how to predict or chart the movements of the market as well as the perfect time to buy and sell a commodity. It familiarizes you with the basic terminologies and the process of trading.

Because forex trading is done in real time and decisions are done on the spot, a trader should be emotionally equipped and prepared to handle the demands, challenges and the stress of the market. And these, one can learn in a forex trading education.

What To Look For in Forex Trading Courses

The Basics. A god forex trading education should include in its program the basics on margins, types of orders and leveraging as these are essential in the forex market transactions. It should teach the basic terminologies, the types of analyses being used, the software and tools and other such important things as charting and leverage. These are essential as the trader learns when to cut back and minimize his losses as well as gain profit.

Analysis. It should also teach you how to analyze common mistakes and at the same time, the ways to avoid such mistakes. Basic to a forex trading course is a detailed discussion on doing technical and fundamental analysis and tools.

Values. More than the theories and the basics involved, a good forex trading education should teach you proper money management and the development of a proper trading disposition and psychology. As the stakes are upped, a trader may become too emotionally involved. It is important that a forex trading course develops the appropriate values needed in money trading, such as discipline, patience and commitment.

Experience. A good forex trading course should provide real life experience through apprenticeship. There is no better teacher than experience, they say, and as forex trading is as real as it can get, forex courses should offer avenues where the student can practice trading. Some courses have live conference rooms or boards where the trader can learn to trade in real time or, in some cases, in a simulated environment. These experiences should also have a one-on-one feedback and forums for discussion and exchange of information and lessons.

For those who’d like to get a good grasp of the market and the rules of the game, there are online sites offering courses and workshops on forex trading. These sites offer courses on risk and money management, trading strategies, technical analysis, market trends and networking. There are also tutorials on the latest softwares and tools being used. There are also online sites that offer lifetime membership and support. Some online schools allow their students to retake the course for updates on the newest trends and strategies. You can try www.trainingacademy.com, www.realtimeforex.com, www.go-forex.net, www.forexmentor.com and www.fxcm.com.

Innovations

With the advent of the Internet, there’s already online forex trading, a system that allows corporations and players in the game to do business virtually. With online forex trading, one can check and monitor the value of the currencies, and even trade directly on the internet. It offers trading of almost 15 currencies, and with the growing number of online traders, it spells more possibilities and more earnings.

Of course, nothing beats the real thing. And a successful forex trader’s skill and knowledge is developed with continued experience. A forex trading education may or may benefit you, but it sure can spell a difference. With the forex market’s volatile environment and fast-paced transactions, one must be fully-equipped with the appropriate tools, knowledge, skill and disposition. The key here is to know the market. Of course, don’t forget to read up on the market, learn how to compare the currency values and generally become a better money manager.
Read rest of entry

Learn How You can Make Gains from Using the Forex trading Grid Technique


The most important part of how to make money using the no stop, hedged, Forex trading strategy will now be covered. In the preceding articles in this series we reviewed trading without stops, not being concerned about which way the price moves and places to cash in on profitable transactions. We are now going to show how you would make money buying and selling simultaneously using the grid strategy.

The no stop, hedged currency trading grid system uses the rule that one should be able to close a transaction at a gain no matter which way the market moves. The only way this is logically possible is that one would have a buy and a sell transaction active simultaneously. Most traders will say that doing this is not recommended but let’s look at this in more detail.

Assuming a grid with grid gaps of 100 pips. We are going to use the simplest formation to show the principles involved. This formation is the 100% retractment formation where the price goes up to a grid level and then returns back to the starting grid level. Regrettably things become quite mathematical from here. We are also ignoring broker spreads to keep things simple.

Let us say that a trader enters the market with a buy (buy 1) and sell (sell 1) deal active when a currency is at a level of say 1.0100. The price then goes to level 1.0200. The buy will then be positive by 100 pips. The sell will be negative by 100 pips. Now we would cash in our positive deal and bank our 100 pips. The sell is now however is carrying a loss of -100 pips. The grid system requires one to ensure that the trader can cash in on any movement in the Forex market. To do this one would again enter into a buy (buy 2) and a sell (sell 2) deal at this level (level 1.0200).

Now, for convenience let us say that the price moves back to level 1.0100 (the starting point).

The second sell (sell 2) has now gone positive by 100 pips and the second buy (buy 2) is making a loss of -100 pips. According to the grid trading rules you would cash the sell (sell 2) in and another 100 pips will be added to your account. That brings the grand total cashed in at this point to 200 pips (buy 1 and sell 2). At this stage the first sell that is active has moved from level 1.0200 where it was -100 to level 1.0100 where it is now breaking even.

The 4 transactions added together now incredibly show a gain:- 1st buy (buy 1) cashed in +100, 2nd sell (sell 2) cashed in +100, 1st sell (sell 1) now breaking even and the 2nd buy (buy 2) is -100. This gives an overall a gain of 100 pips in total. We can liquidate all the deals and have some champagne as we have made a profit of 100 pips.

Please make sure you understand the mathematics behind the activities discussed above. You may have to reread and draw the movements on a piece of paper to make sure you understand the concept.

This formation is the 100% retracement formation where the price goes up to a grid level and then returns back to the starting grid level and results in a nice profit for the forex trader. There are many other market movements that turn this strange Buy and Sell at the same time activity into profits. The next article will cover the 50% retractment formation which produces the same amount of profit.

There will be much more on the no stop, hedged grid trading system in future articles in this directory. Do not miss them, whatever you do.
Read rest of entry

Trading Forex Right in the Comforts of Your Own Home


Trading in financial institutions is one of the best ways to earn money. It is also one of the most promising career choices that people make today. With the opportunity to earn a lot of money, more and more people who are interested in trading in the financial institution have left their jobs to get a piece of the action in the financial market.

Today, the Forex market is the best choice for people who are considering making a career out of trading in the financial market. Besides, who wouldn’t want to trade in the largest and the most liquid market in the planet which involves all the countries in the world?

The Forex market operates 24 hours a day with currency exchanges that can go as high as 2 trillion dollars each trading day. Also, it is the most liquid market in the world which also means that traders can enter the market anytime they want and get their profits easily.

In the past, Forex was limited to large financial institutions and multinational companies. Only banks, central banks and large companies were allowed to participate in the Forex market. However, thanks to modern communications technology and high speed internet and decreased sanctions in the Forex market, ordinary people can now trade and participate in the world’s largest financial market.

Because the Forex market is now open to everyone and because it is a very profitable industry, online Forex brokerage firms began improving their services and accessibility. They now also designed different trading platforms suitable for different Forex traders. Not only has online Forex brokerage firms made their trading platforms accessible, they also began and still continuing to improve their software.

They also allow people to register with a Mini Forex account that can let them trade with a minimum margin of 100 dollars only or even less.

If you are interested in joining the Forex market, you only have to have a few things to get you started.

First, you need a computer with a high-speed internet connection. The high-speed internet connection is very important for an effective trade to work. It will also minimize the risk of slippages that can cause you to lose money. So, if your area doesn’t have any high-speed internet connection available, you should forget about trading in the Forex market online. This will only make you lose a lot of money.

Second, you need to choose which Forex brokerage company you should hire. These companies will provide you with the Forex trading platform that you can easily download and install in your computer. The Forex trading platform is simply a software program that is essential for an online Forex trader.

It is important for you to choose a trading platform that you are comfortable using. You should also make sure that the trading platform you choose provides accurate and up to date real time information, security, and stability.

It is also recommended that the trading platform you choose should provide information on at least 16 currency pairs, execute orders with just a click of the mouse, have charting tools to perform technical analysis, and should also have a recording feature that will store your trading history.

With all these features, you can really improve the way you trade in the Forex market and also minimize the risk of losing money.

Look for a Forex trading platform that is simple to use and easy to understand. If you wish to know more about the Forex trading platform that a Forex trading brokerage firm offers, you can consider opening a dummy or practice account. By doing this, you will never risk real money on trades while learning the ropes.

You will also get hands on experience on the Forex trading platform and really determine if the platform is for you or not.

Risk management is also a very important feature that you should look for. If it takes too long to select a risk management order, you should consider looking for another Forex trading platform.

These are some of the things you should look for in a Forex trading platform. With a little practice in the dummy account, you can be sure that you can get the hang of it in no time at all and start making money through online Forex trading with a reliable Forex trading platform.
Read rest of entry

Information that You Should Always Watch Out For


Getting the necessary and the right information is one of the most important things in order to be successful.

In a company, in the military, in the government, and virtually in any kind of organization, getting the right information is necessary to make the right decision. This is where all decisions are based from. Information plays a vital role in the society.

For example, in the military, making the right decisions during war or even during peacetime is necessary to save and protect lives. In the business world, it is also necessary to get the right information to make the right decision in order for a company to grow and profit.

Most wrong decisions are usually made because of lack of information or because of getting the wrong information.

Here’s another example on what happens when decision makers get the wrong information. Countless leaders of countries have been ousted because of one minor glitch in the information that their advisers gave them.

It cannot be stressed enough that it is necessary for everyone to get the right information. After getting the information, you should study it, and formulate a decision that you think is right for the current situation.

This is also true in the financial market, such as the Forex market.

The Forex market is the largest and the most liquid market in the world which operates 24 hours a day and generates currency exchanges up to two trillion dollars each day. This market has no centralized location as trades are open 24 hours a day in different parts of the world.

It is a fact that the Forex market made lots of people rich and also taken a lot of people in the brink of financial collapse. The Forex market can really be a difficult market for you, as an investor. It can only mean two things, either you make it big by getting lots of money or you can really lose big time.

With the constant oscillation of currency value in this market, it is necessary for you, as an investor to obtain the right information to base your decisions from. The right and wrong information or late information can mean the difference of you hitting the jackpot by earning lots of money or you losing a lot of money.

Having the necessary skills and knowledge about the Forex market is simply not enough for an investor to be successful. It is a known fact that there are lots of seasoned Forex investors or traders who have lost a lot of money in this financial market. Some even got into debt or bankruptcy.

This is why you should first consider your options whether you should join the Forex market or not. However, the fact that you can make lots of money in this market can really attract you. Besides, the Forex market can offer you a chance to make the big bucks.

So, if you want to join the Forex market or if you already have an active, funded account, you should make sure that you have access to the right kind of information.

It is recommended that you should hire technical and/or fundamental analysts or brokers if you don’t know a thing about Forex charts and graphs. The news also plays an important role in the Forex market.

These people can help you make the right kind of decision by informing you with all the necessary information on what currency you should buy and sell.

Although they will charge you a fee for their services, you can be sure that you will be getting the right information on time that will help you in your decision-making. So, to make it short, you should hire these people’s services.

Even if you know how to read the charts, there are simply too many things that you have to consider; there are just simply so many indicators about the different aspects in the Forex market that you should keep an eye on. Simply reading one kind of chart can be very difficult. Try combining it with another chart, and not to mention that you still have to make decisions.

Always remember, if you want to be successful in the world’s largest financial market in the world, you should get informed with the right information on time. You should always keep in mind that the information that analysts and brokers provide you is the key to success.
Read rest of entry

Sunday, June 21, 2009

What is a Forex technical indicator?


As you would know, foreign exchange is the largest market in the world, and the amount traded between the different currencies each day exceeds by far the largest stock market exchanges put together!
Though the concept of forex trading was developed unofficially hundreds of years ago, it is only with the advent of technology that the real forex trade began in the world.
To aid people to trade between currencies, there are several forex theories in existence. For instance,
· Technical Analysis
· Indicators like Relative strength index
· Elliott wave theory
· Numbers sequences like Fibonacci
· Gaps – High-Low and Open-Closing
· Following moving average trends
· Japanese Candlesticks, Triangles, and other chart formations
· And so on…
Depending on your forex broker (or if you learn on your own, depending on your own study), you will use one of these forex theories to trade; and the mistake that a lot of novice traders do is that they use multiple forex theories simultaneously without proper knowledge.
When you are trading online, you need a lot of patience and need a lot of time to learn the ropes. Unless you do that, none of these forex theories can help you make a steady source of income. Or what you can do is you can shift to an online platform to trade. With an online platform or well known software like Fapturbo, you are assured of these forex theories being put into real use by your computer. That is the right decision for a newcomer into the markets to take, as you practically cannot use all these theories in conjunction at the same time. If you try to do that, you will only create frustration for yourself, and lose a bunch of money!
Read rest of entry

What’s Fibonacci Forex Trading?


Fibonacci forex trading is the basis of many forex trading systems used by a great number of professional forex brokers around the globe, and many billions of dollars are profitable traded every year based on these trading techniques.

Fibonacci was an Italian mathematician and he is best remembered by his world famous Fibonacci sequence, the definition of this sequence is that it’s formed by a series of numbers where each number is the sum of the two preceding numbers; 1, 1, 2, 3, 5, 8, 13 ...But in the case of currency trading what is more important for the forex trader is the Fibonacci ratios derived from this sequence of numbers, i.e. .236, .50, .382, .618, etc.

These ratios are mathematical proportions prevalent in many places and structures in nature, as well as in many man made creations.  

Forex trading can greatly benefit from this mathematical proportions due to the fact that the oscillations observed in forex charts, where prices are visibly changing in an oscillatory pattern, follow Fibonacci ratios very closely as indicators of resistance and support levels; maybe not to the last cent, but so close as to be really amazing.

Fibonacci price points, or levels, for any forex currency pair can be calculated in advance so that the trader will know when to enter or exit the market if the prediction given by the Fibonacci forex day trading system he uses fulfills its predictions.

Many people tries to make this analysis overly complicated scaring away many new forex traders that are just beginning to understand how the forex market works and how to make a profit in it. But this is not how it has to be. I can’t say it’s a simple concept but it is quite understandable for any trader once he or she has grasped the basics and has had some practice trading using Fibonacci levels along with other secondary indicators that will help to improve the accuracy of the entry and exit point for every particular trade.
Read rest of entry

Elliott Wave Theory – The Myth and Reality


Elliot wave theory enjoys massive popularity - being described as advanced technical analysis, by many brokers and publishers.

Elliot wave theory has a huge and devoted following - shame the theory has no basis of sound logic that can help you make money!

Let’s look at Elliott wave theory in more detail and then look at sensible market analysis.

The theory was named after Ralph Nelson Elliott, who concluded in his book “natures law” that the movement of financial markets could be predicted by observing, and identifying a repetitive pattern of waves.

Elliott’s Profound Observation

Elliott came to the stunning conclusion that all natural phenomena are cyclical - and this includes the financial markets. This is true, but we know that anyway - we know that at some time in our lives, we will feel rain when we venture outside, the question is when exactly?

So, markets are cyclical - big deal! What we want from an investment theory, is the probability of the event - i.e. when is it most likely to occur.

Elliott wave theory is an objective investment theory - but there isn't any objectivity in it at all!

It's all a subjective interpretation of peaks and troughs, in any time frame you like!

Does this sound a logical predictive theory to you?

The Theory

Based on rhythms found in nature, the theory suggests that the market moves up in a series of five waves and down in a series of three waves.

The difference between the Elliott wave principle and other cyclical theories is that the theory suggests no absolute time requirements for a cycle to complete - well that’s a lot of help!

The subjectivity is so great in Elliott wave, that like most theories, everything is explainable in hindsight - but the difficulty is actually predicting the future.

There are so many interpretations of the actual peaks and troughs in various time frames, that everyone will see them differently, this is hardly the basis of a predictive theory.

Elliott wave theory claims to be able to predict the market - but gives no objective way of doing it in practice.

Who uses Elliott Wave Theory?

1. Investors who want an easy way to make money, and are attracted to the mysticism of such tools as the Fibonacci number sequence, to predict market retracements.

2. Investors who believe in the false assumption that you can predict market behavior in advance - and want an easy way to make money.

How Markets Really Move

Market prices are a reflection of the following:

Supply and demand fundamentals + human psychology = price action

This looks simple, but is in reality, complicated equation - which is impossible to predict in advance.

Trading markets via technical analysis is all about putting the odds and probability in your favor, and no more than that. It is NOT a way of predicting the future.

Are there better theories than Elliott wave around, for making money from the markets? - A good exercise would be to poll the entire top performing fund managers in the world and see how many of them take the theory seriously.

Predictive and subjectivity don’t mix!

The Elliott wave theory is a predictive theory that leaves everything to subjective analysis.

If Elliott had worked out a predictive theory, why didn’t he give an objective way to make money from it? - Like most predictive theories it doesn’t work.

If all investors could predict the market in advance, we would all know what was going to happen - and there would actually be no market at all, as we would all know the market price in advance!

Elliott wave theory is supposed to be a predictive theory, but the only thing you can predict with it, is you will lose your money.
Read rest of entry

Sunday, November 23, 2008

Theory: When to Exit

..you actually make bugger all money if you can't execute and exit as precisely as you entered...

Hi all,

Welcome to another article, this time on when to exit a trade. When beginner traders start looking for that magic "make me a bucket load of cash" trading system, quite often the last thing thought about is their exit strategy. Usually the first and most important thing on a traders mind is when to enter a market, forgetting that you actually make bugger all money if you can't execute and exit as precisely as you entered.

There are three main scenarios that a trader will find themselves thinking of their exit:
  1. A trade has moved as expected and they are in profit
  2. A trade has moved opposite to what they expected, and they are in loss
  3. A trade is dancing around the neutral zone of their trade
At first glance, you would think the easiest scenario of the three to exit under is number 1, i.e. when you are in profit, after all you are "cashing in" so how hard can it be. In fact, in reality all three can be as hard as each other. The reason?, like most things with trading, it comes to emotion. Below I have added the underlying emotions that might stop you closing a trade under these three scenarios:
  1. A trade has moved as expected and they are in profit (GREED)
  2. A trade has moved opposite to what they expected, and they are in loss (OPTIMISM)
  3. A trade and dancing around the neutral zone of the trade (FEAR)
Let's look at them one by one.

Cannot close a profitable trade (Greed)

Everyone fights greed every day in life, always "wanting" rather than sticking to what you actually "need". It is part of a materialistic modern day culture that most of us are subject to. Trading is no different, and it is usually greed that can turn a nice logical, well planned and profitable trade into a losing one. When this happens, a trader reacts two ways, one, they are distraught at themselves for letting it all get away, or two, they tell themselves "well I was right with my prediction, the market just had it in for me".

Think of this, you set up a trade, monitor the setup closely, wait for the exact time to enter a trade, calculate your stop loss, your order is hit and you are in the trade. The price action moves beautifully, moving quickly towards your scantily thought about target (if you set one), and the sense of delight sends your brain into overdrive, working out the profits, imagining the ferrari soon to be in the drive-way, wondering if 2000 pips has ever been done in one day. This is when you know you are in some trouble, this is when greed has started to set in, you remove your profit target thinking "let's see how long this goes", you don't move your stop loss, cause you don't even contemplate that it might reverse, and you "go for the ride".

A common saying is "cut your losses, and let your profits run" (or something like that ;)), and it is a very good theory that should be followed. However, how do you ride your profits, without risking a reversal that you will undoubtedly put down to "a correction that will soon move back my way".

Personally I look at it this way:

  1. Move your stop loss to break even or better as soon as is logically possible without risking being whipsawed out, that will ensure you will not lose money on the trade, ease the stress, and bring peace to the world (ok maybe not that). I take the view of never let a winning trade turn into a losing one so at least lock in 1 pip if it makes you feel better.
  2. If the move was stronger that you anticipated, and you had a 20 pip profit target. Remove your profit target, and move your stop loss to the profit target as soon as possible. What you effectively have done is close your trade (because your stop loss is at your original target) and you are letting your profits run at the same time, two for the price of one, bargain!
  3. Continue to follow the trade with your stop loss, and remember, 20 pips was your target, be satisfied with whatever you can get after that, but don't take any less. You can use one of the many trailing stop techniques to do this or look at the parabolic SAR indicator.
Cannot close a losing trade (Optimism)

I was tempted to use the word "Dillusion" for this one but felt perhaps that is a little harsh, you know the deal, you enter a trade, you set a 25 pip stop loss, the trade moves the wrong way and you are -20 on the trade, you look at the chart again frantically, and optimistically think "Oh of course ... I should have set the stop loss beyond that resistance level from the year 1967, what was I thinking" and you change your stop loss, making it -35. The price continues to move in the wrong direction, and you either cop a -35 pip loss instead of -20, or you remove your stop loss all together and spend the next week driving everyone nuts asking "will the EUR/USD go up?" to every trader in the chat room.

... Some may say, that they removed their stop loss and eventually, their -100 pips turned into +10, so there .. stick that up your jumper ...


What you do when you move a stop loss further away from entry, is completely change the ratio of the trade you entered. What was originally a 2:1 trade, i.e. your potential gain was twice as large as your potential loss, becomes a 1:1 trade, which is just asking for a margin call very quickly.

My advice on this? NEVER NEVER (I think that is pretty clear) move a stop loss further away from your entry, you can move it closer or break even if you wish, as this improves your risk/reward ratio, but never away. Some may say, that they removed their stop loss and eventually, their -100 pips turned into +10, so there .. stick that up your jumper ... the only problem is, that while they waited the week out waiting for the price to turn around (sometimes it never does .. look at the USD/JPY at the moment) they have tied up the entire margin, meaning they are locked out of many many more potentially profitable trades. So while you might end the week at +10, in the meantime other trades cut their losses at -20, entered 15 more trades in the week, and finished +100 for the week and at the same time learnt a hell of a lot more.

You want to close a trade dancing around the neutral zone (Fear)

This one is different, this is when you have a trade at +1, 0 or -1 pips, right around your entry, and it hangs there for quite a while, what do you do? Do you take a really small gain of +1 "just in case" it turns? Personally, and this one is up to you, I say never close a trade around the neutral zone of a trade, the ultimate aim of a trader, is to see a movement before the majority of others, you can then get in early, and when the others have caught up, let them make you money.

If you have spent the time analysing a trade, trust your judgement, if you analysed correctly, you may have got in early and it will take some time for the others to catch up. Don't be fearful of a losing trade, instead trust what you saw in the first place when you placed the trade. Sure there will be times when you end up losing, but if you cut your losses and let profits run, then you will be well in front in the end.

... If a trade has moved 1 pip past your target (that you have not automatically set), why close it? ..
Read rest of entry

Theory: What To Trade?

... I can't tell you what to trade as much as the next person, essentially you need to make that decision yourself ...


Hi there!

Time for another theory article while the markets are quiet, this time on the first question asked by every new trader I see in the chat rooms, "Can someone tell me what to trade?". Now I can't tell you what to trade as much as the next person, essentially you need to make that decision yourself, not rely on others to tell you what to do, but we can look into how some currency pairs behave to give us a hint into what will suit you.

There are a multitude of currency pairs out there, pick a countries currency, and there will probably be a broker out there trading it, but what we want to look at is the most commonly traded pairs, or the majors as they are refered to. Below is a list of the major currency pairs most commonly offered:
  • EUR/USD (Euro/US Dollar)
  • GBP/USD (Pound/US Dollar)
  • USD/CHF (US Dollar/Swissy)
  • USD/JPY (US Dollar/ Yen)
  • AUD/USD (Australian Dollar/US Dollar)
  • USD/CAD (US Dollar/Canadian)
Now what do you notice is the common theme through them all? Yep the USD, all the majors either have the USD as the base currency or are matched against the USD. You will find the above list will also have the tightest spreads (see Forex 101 for an explanation on spreads) with most brokers, and will have the biggest daily ranges (difference between the daily high and low).

So what to trade?, if you are a beginner trader, without a tested and trusted system in place, it would be best to choose a couple of these pairs only. More than 2 or 3 will more than likely confuse the buggery out of you, and the last thing we need is to trade confused (I live my life confused, so I would rather not trade that way ;)).

The GBP/USD (known as the "cable") is very popular amongst traders as it tends to have the highest daily range, giving up more pips in it's moves than any other on average. The EUR/USD is also popular as it tends to have the smallest spread with most brokers, why the USD/CHF is another that has some substantial movements.

... as you trade you will start to notice the relationship between the different majors ...


Quite often which pairs you choose might be to do with when you trade. If you tend to trade the asian session the most, the pairs that include asian or oceania currencies would be a good choice such as the USD/JPY, AUS/USD or even, while not a major, the NZD/USD. Those trading the european session of course might choose teh EUR/USD or the GBP/USD, which just about all the majors are ok to trade during the US session.

As you trade you will start to notice the relationship between the different majors, such as how the EUR/USD and GBP/USD tend to mimmick each other, and that if the EUR/USD is going down, then more than likely the USD/CHF is going up. This of course is because they both have the USD as part of their pairing, so if the USD is getting stronger, the EUR/USD will be moving down (Euro getting weaker against a strengthening USD) and the USD/CHF moving up (USD strengthening against the Swissy).

The only exceptions to this relationship will be when country specific news is released, such as a good economic meter reading in switzerland might move the USD/CHF but not the GBP/USD and so forth.

Whichever you choose, there is money to made and lost just as quickly, so be sure to keep your money management tight and your head clear.

Happy trading!
Source: www.akuma99.blogspot.com
Read rest of entry

Theory: ADX

Hi all! Well I have mentioned previously that the only indicator I consistently keep on my charts is an indicator called the ADX, or Average Directional Index (why do they always like using "X" for index .. shouldn't it be "I" ... anyway). I use it primarily to keep me in trades that are moving strongly, and to give me hints on how strong a move actually is.

So, considering I talk about it so often I thought it best to give a general rundown on what the indicator can be used for and how you might be able to use it in your trading system.

The ADX was developed by J. Welles Wilder, yep the same guy who developed the Parabolic and RSI indicators, clever chap that Wilder. Interestingly, Wilder considered the ADX to be his best achievement in terms of indicators, and considering the widespread use of RSI and Parabolics, makes you wonder why more aren't using the ADX (although I am sure plenty are, I have after all only surveyed my next door neighbour and my dog).

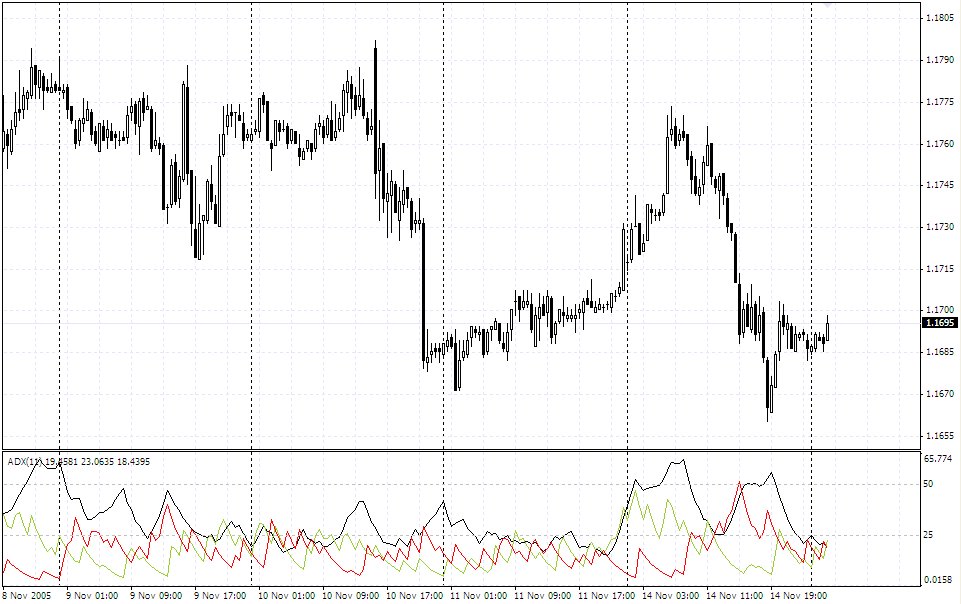
First of all let's have a look at what it looks like:

At first it looks all a little like last night's spaghetti, but really it is quite simple. There are three lines, a trend following line, a positive directional line (+DI) and a negative directional line (-DI). In laymans terms, the black line tracks trends, the red line is a signal line to go short, and the green line a signal line to go long.

First the theoretical way to use it. When the red (-DI) line crosses above the green (+DI) line, it is a signal to go short, and vise versa, green above red is a signal to go long (yep just like Moving Average crossovers). Like all indicators though, there is always lag, and as such I pay little attention to these lines and prefer to get my direction signals of the price action itself. The black line though is something different, it is a line that indicates if a trend is in place. If it rises from below 20 (I use 25) to above 20, it is a sign that a trend is developing and to stick with the trade. While the black line rises, I will always stay with a trade unless there is some news announcement coming up that I am worried about. Once the black line ticks down from above 25, it is a signal for you to assess your position as the run may have come to an end for now.

While such a simple technique (I am all about simplicity), you will be surprised how well it will keep you in those strong moves. So that is it, pretty easy huh ... any questions, just throw me an email or comment here.

Best of luck with it.
Source: www.akuma99.blogspot.com
Read rest of entry

Theory: Candlesticks

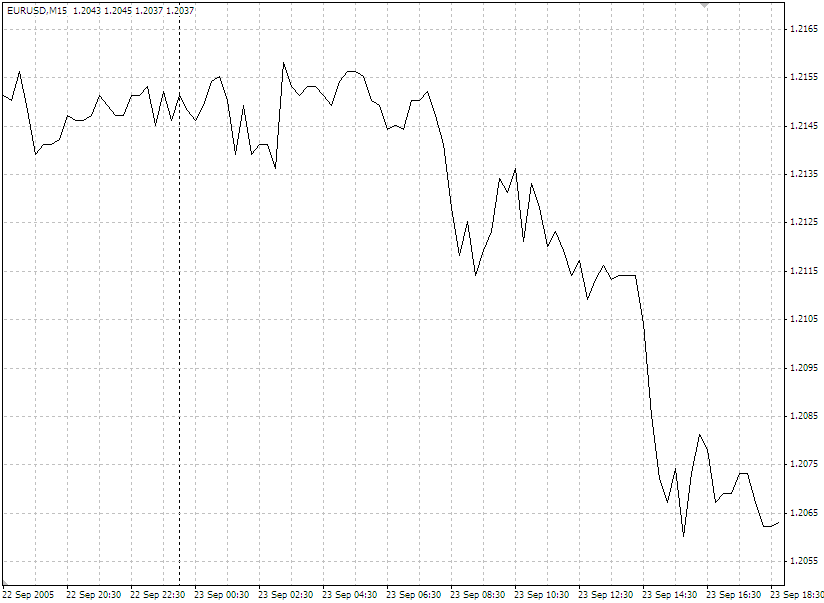
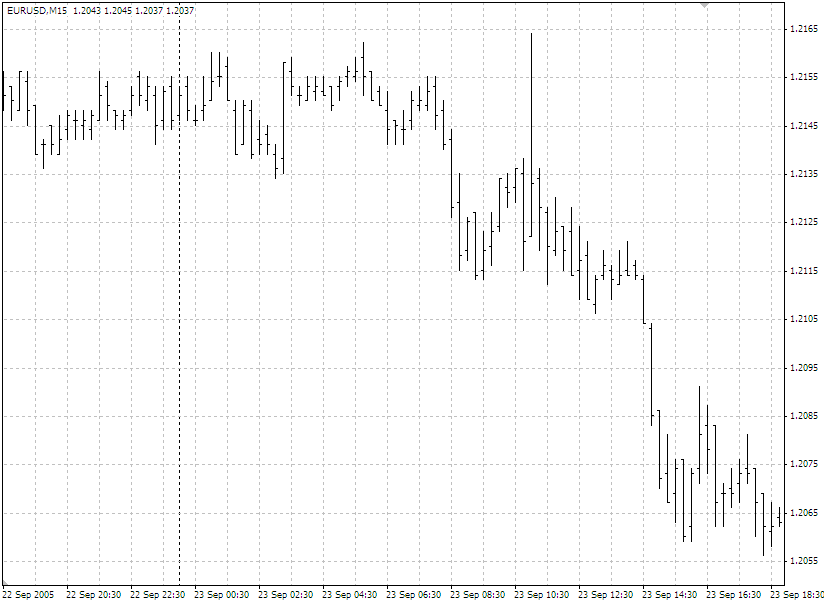
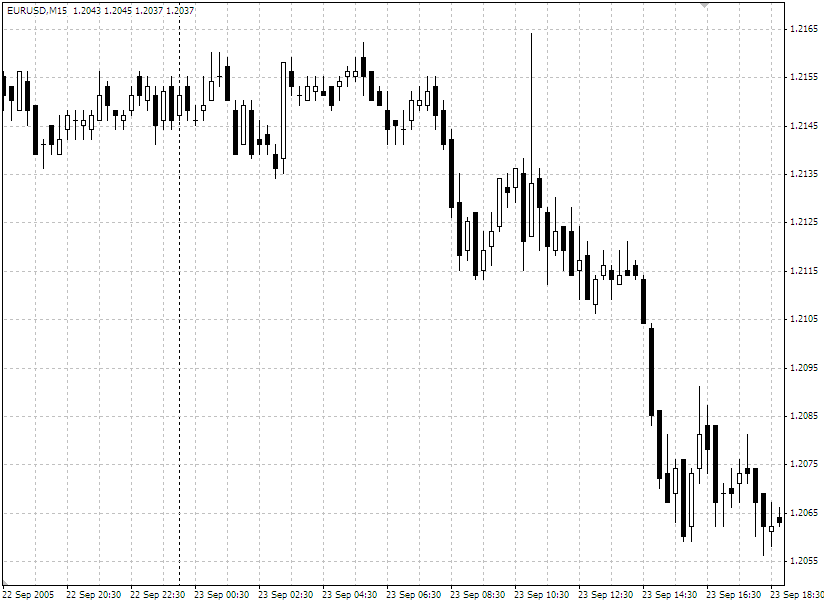
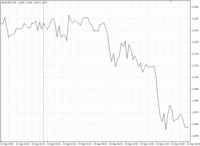
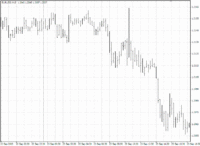
Hi all, today I'll have a quick chat on the theory of Japanese Candlesticks. In case you did not realise, there are three main ways to view a trading chart, you can view it as a line chart, a bar chart, or a candlestick chart. Below are what each of these look like:
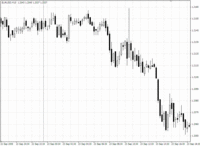
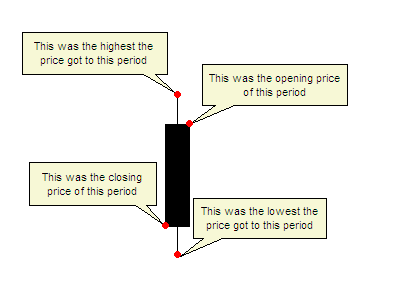
Candlestick's were first introduced in the 1600's, strangely enough to analyze the price of rice contracts. There is no special calculation, they are simply an alternative way of representing current prices. Below is the basic rundown of what a single candlestick looks like, and how it is interpreted.
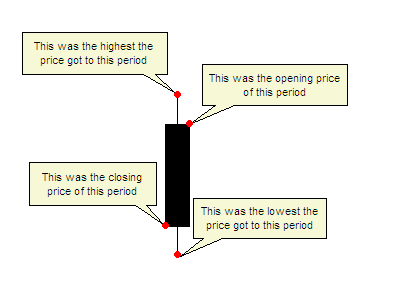
This is a candlestick you would see most often in a downtrend, with the black body being a sign that the closing price finished lower than the opening price.

Here you can see labelled the opening, closing, high and low of the particular period that this candle is representing, which could be 5 minutes, 1 hour or 1 day depending on what chart you are looking at.

Some charts have candles that represent this scenario coloured in red, either way, the main thing is to remember that usually this type of candle will usually be filled.

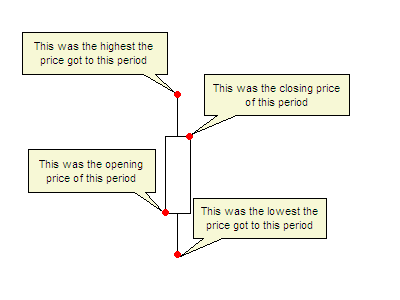
So that is what a "down" candle looks like, a candle representing the opposite scenario, i.e. when the closing price finishes above the opening price usually is white, or uncoloured and looks like below:
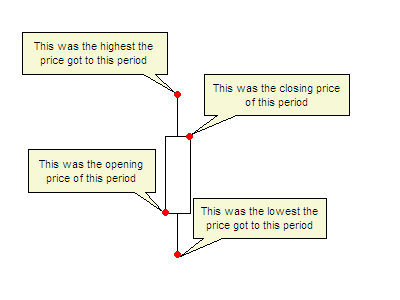
You can see that the main difference between this candle and the above candle is that the closing price is above the opening price, indicating that during this period, the price went up during this period.

Some charting packages will show this candle as a green candle, some as white, or some with no colour at all, just an outline. If you set the colour scheme yourself, just recognise that you need to make this candle different to the above candle so you can distinguish the difference.

Now if I was to run through every type of candle that existed in the theory of candlestick charts, I would more than likely get cramp and brain freeze, and not finish this article. So instead, I will run through some basic deduction you can take from interpreting a few different types of candles.
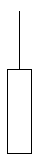
Have a look at this candle (called an inverse hammer), you can see the main difference between this candle and the basic candle I showed you above is the lack of a thin line below body (the thicker white area) of the candle. So what does this mean? The thin lines are refered to as "wicks" or "shadows", and represent when prices move up or down, but are then dragged back.

How to read this candle? Well here the price closed well above it's opening price, there was a push for higher prices as represented by the upper wick, which was pulled back slightly. Depending on the market, you may read this as a sign that price will continue with the upward push, as the price didn't retract too far, and there was no real push for lower prices.
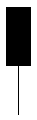
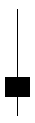
Ok here is another (called a hammer), the inverse of the previous candle, here you can see the closing price was lower than the opening price, hence the black body of the candle. It has a medium length wick also, which again is a sign that there was a move to push the prices lower. You make this candle to be a sign of strength in a down move, or a sign of a reversal, or pause in an uptrend.

To me the wicks are just as important as the bodies of candles, and should be taken into as much consideration as the colour and length of the body. Now there are a bucket load of different candle types as I mention earlier, but to give you an idea, here are a few that I find to be the most telling when reading candlestick charts.

This candle is referred to as a "doji", and you can see has very little, or in this case no body to it. This candle is a sign of indicision in the market, as the wicks above and below the non existant body reflect that there was a push up, and a push down, resulting in a stalemate with the opening price and the closing price being the same in the end.
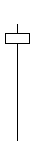


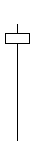
This candle, a hammer, is a strong sign if seen at the bottom of a downtrend, when you suspect that a currency may be oversold. Here you can see a very long bottom wick in comparison to it's body, and tells the story that prices made a strong move down, but was dragged back above it's opening price, hence the white body. A candle with such a long wick as this, is usually a good sign that the momentum of a downward move is stalling or reversing.
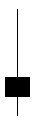

Here you can see a variation on the inverse hammer candle I showed you previously, with the main difference being that this one having a much longer upper wick, and the closing price finished below the opening price. This candle can quite often be a sign of a change in momentum, as the strong push to higher prices, as shown by the long upper wick, was pulled back so far that the prices closed lower, a sign that future pushes to higher prices may be rejected. This candle is especially valid in an uptrend where you may suspect that a currency is overbought.

There are so many more, and I haven't even touched on combining these candles into different formations. I have however, provided a link to an e-book on this subject that covers all the basics in a text book fashion that can be a good reference for you all.

Please do not take this candles as given, like any other indicator, they are just guides that can help you, but it is always safe to look for confirmation either in the next candle or with other indicators. Oh and one last tip, never trade on an incomplete candle, always wait for that period to end before assuming the candle is a certain type. Quite often the biggest moves are at the end of the period you are looking at, and what you thought was one type of candle become something completely different in the matter of seconds.

Best of luck with them, I personally feel candles tell you much more than a line graph ever could, and while bar charts can tell you the same information, I find candlesticks much easier, and more importantly, much faster to read. Please leave a comment if there is something vital I have missed.
Source: www.akuma99.blogspot.com
Read rest of entry

Theory: Chart Correlation

I thought I would mention a very simple concept that I know a lot of traders know of, but there may be some who don't. The concept is of chart correlation, i.e. when one pair goes up, another pair goes down.

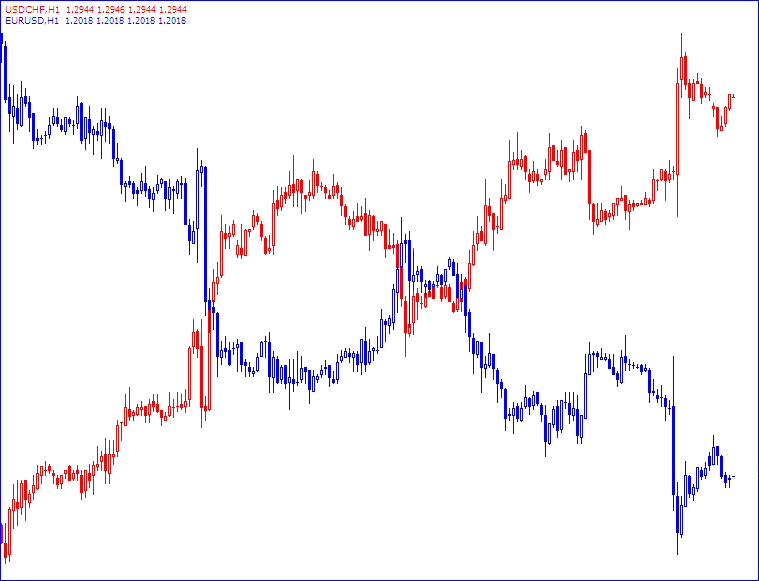
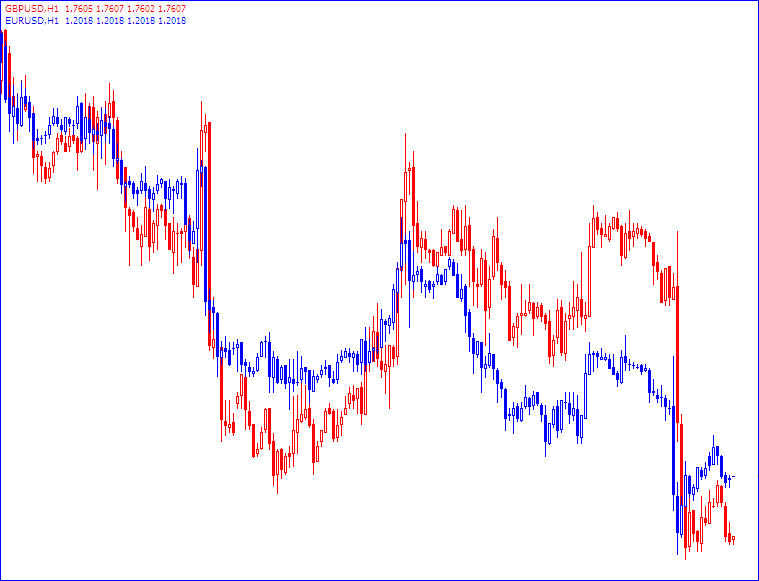
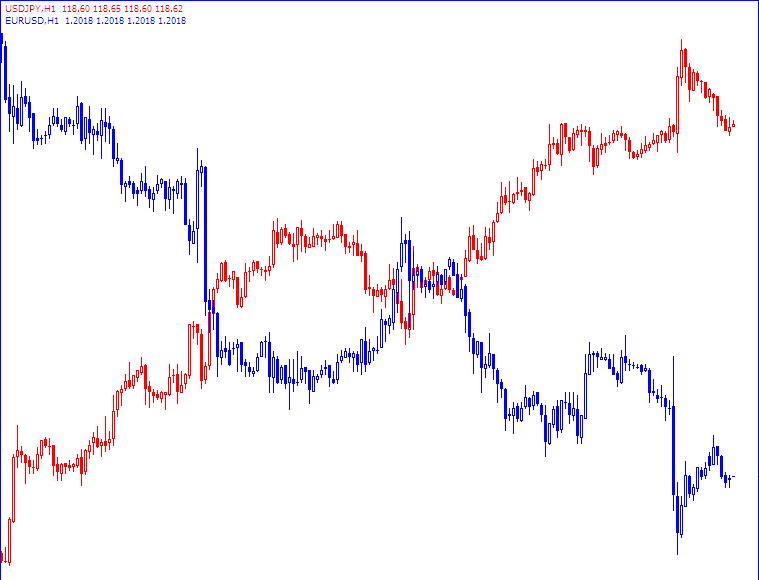
This concept is especially true for all the majors and there is a very simple reason why. All the majors have one thing in common, the USD, in general it is the USD that drives the pairs up and down, there are of course the odd exception with region specific data releases etc, but as a whole it is the USD that drives things. So if the USD gets stronger, then more than likely the USD/JPY will rise, while the EUR/USD will fall. Don't believe me? Let's look at some charts I have prepared earlier ;), I have overlayed and coloured them to make them easier to compare:

EUR/USD 1H over the USD/CHF 1H

You can see they are practically mirror images of each other. Now how about two pairs with USD as their base currency, lets look at the EUR/USD again but against the GBP/USD:

EUR/USD 1H over the GBP/USD 1H

You can see they play follow the leader for most of the time. You can see then that most of the time, it would be contradictory to have a swing trade short on the EUR/USD and a short on the USD/CHF at the same time, one is doomed for failure. You can compare all the majors and the action is essentially the same, here is the EUR/USD over the USD/JPY:

EUR/USD 1H over the USD/JPY 1H

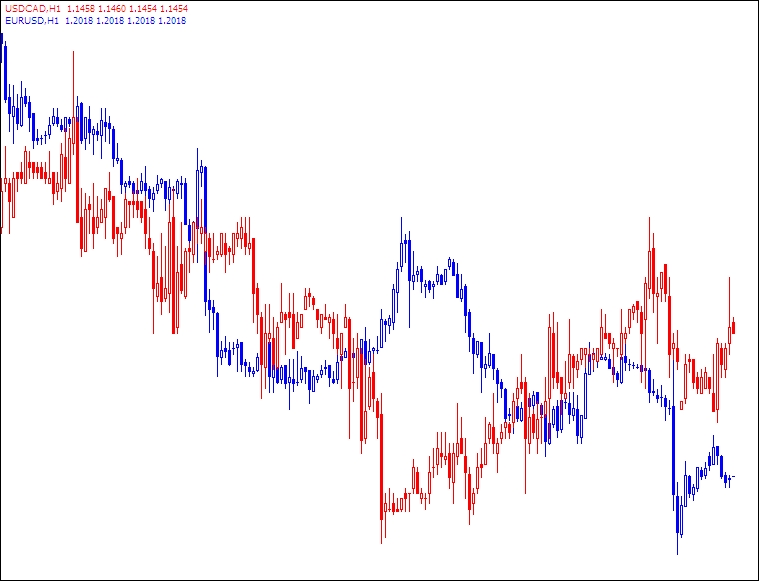
I think I have made my point. There is however the odd exception, although not amongst the majors, currently that "black sheep" is the USD/CAD. You would expect, with the USD as it's base also it should follow the pattern of the USD/JPY and the USD/CHF, but, as it is a commodity and energy reliant pair, and considering the current energy crisis the world is under, the USD/CAD currently is leading it's own life. Here is the EUR/USD over the USD/CAD to show you what I mean:

EUR/USD over the USD/CAD

You can see, apart from the new year action that for quite some time the USD/CAD bucked the trend, and moved in the same direction as the EUR/USD as demand for oil prices rose, gold hit new 5 year highs and the canadian economy was going great guns. If you have a charting package that let's you overlay charts, then it is well worth doing every now and then to see how pairs are moving compared to others, it just may stop you trading against yourself.

Source: www.akuma99.blogspot.com
Read rest of entry
 
Copyright 2009 by Forex and Trading Theory